
Quick Summary
Choosing retail analytics software is easier when you compare it against your real business needs. Look at reporting accuracy, sales and inventory insights, dashboards, integrations, multi-store visibility, ease of use, forecasting, security, and total cost. The best retail analytics tools are the ones your team can use confidently to make faster, better decisions.
Table Of Contents
Introduction
Retail analytics software turns sales, inventory, store, and operational data into useful reports and insights. But choosing a tool is not only about having more dashboards. You need reliable data, useful reporting, compatible integrations, easy adoption, and predictable costs. Before comparing vendors, define the decisions your team needs the software to support and test those workflows during a live demo.
Key Takeaways
Match the software to specific business requirements instead of buying based on feature count.
Verify data accuracy, refresh frequency, security, and reporting consistency during the demo.
Check integrations and multi-store visibility before committing to a platform.
Test dashboard usability, custom reports, filters, exports, permissions, and mobile access.
Compare scalability, implementation, support, subscription fees, and total cost of ownership.
10 Features to Compare When Choosing Retail Analytics Software
1. Sales Performance Tracking
Start with the questions your sales team asks every week. A useful platform should show revenue, units sold, average transaction value, product and category performance, and comparisons by date or location.
Demo test: Ask the vendor to show the same product or category across two periods. Check whether you can drill from the total into the store, product, or transaction-level detail you need.
2. Real-Time Reporting and Data Refresh
If reports are updated hours later, managers may act on information that is already outdated. Check how often data refreshes, how quickly new transactions appear, and what happens when a store works offline or a connection is interrupted.
Demo test: Make a sample transaction and ask when it should appear in the dashboard. Then ask how the system handles delayed synchronization and conflicting data.
3. Inventory Analytics and Stock Visibility
Sales data is much more useful when you can connect it with stock. Look for stock levels, turnover, slow-moving products, ageing inventory, and stockout indicators. The important question is whether sales and inventory can be analyzed together.
Demo test: Pick one product that sells quickly and one slow mover. Ask the vendor to show sales, current stock, movement, and ageing in the same workflow.
4. Customizable KPI Dashboards
A dashboard should answer a manager’s most important questions without forcing them through unnecessary screens. Check KPI selection, filters, visual clarity, role-based access, and whether different users can have different views.
Demo test: Ask for separate views for an owner, store manager, and operations manager. See whether each user can reach the metrics they need without rebuilding the dashboard every time.
5. Multi-Store Reporting and Comparisons
If you operate multiple outlets, consolidated reporting is essential. Effective multi-store management helps retailers compare stores using consistent definitions and filters while allowing managers to inspect individual locations.
Demo test: Ask the vendor to compare three stores for sales, average transaction value, and inventory performance. Confirm that you can move from the consolidated view to a specific outlet.
6. Data Integration and Compatibility
Analytics is only as good as the data feeding it. Check compatibility with your billing or POS system, inventory, accounting, ecommerce, marketplaces, and other systems you already use. Connected retail operations can help bring sales, inventory, and operational data together for more consistent reporting.
Demo test: Draw your current data flow on one page and ask the vendor to map every connection. Confirm what is native, what needs an API or connector, and what requires manual uploads.
7. Custom Reports and Data Export
Dashboards and reports solve different problems. A dashboard helps teams monitor KPIs; custom reporting helps them answer a specific question and share the result. Check report builders, filters, scheduled delivery, export formats, and sharing controls.
Demo test: Ask the vendor to create a weekly sales report for one store, filter it by category, export it, and schedule it for a manager. This exposes how much manual work is really required.
8. Demand Forecasting and Trend Analysis
Forecasting can help retailers plan demand, but do not choose a tool simply because it says it uses AI. Check what historical data the model uses, which variables it considers, how forecast accuracy is measured, and whether the output fits your planning process.
Demo test: Ask the vendor to explain one forecast from the source data to the final recommendation. Confirm what happens when data is incomplete or demand changes unexpectedly.
9. Ease of Use and Accessibility
A powerful platform will not create value if store and management teams avoid using it. Evaluate navigation, report creation, onboarding, training, permissions, and mobile access where relevant.
Demo test: Give the salesperson three tasks without telling them how to complete them. For example: find yesterday’s sales, compare two stores, and export a report. Watch how many steps each task takes.
10. Scalability, Pricing, and Total Cost of Ownership
Look beyond the starting subscription price. Compare the cost of additional outlets, users, transactions, integrations, implementation, training, support, upgrades, and future requirements. A lower entry price can become expensive if important capabilities are charged separately.
Demo test: Ask for a three-year cost scenario based on your expected store count, users, integrations, and reporting needs. Get every recurring and one-time cost in writing.
How to Evaluate Retail Analytics Software Before Buying
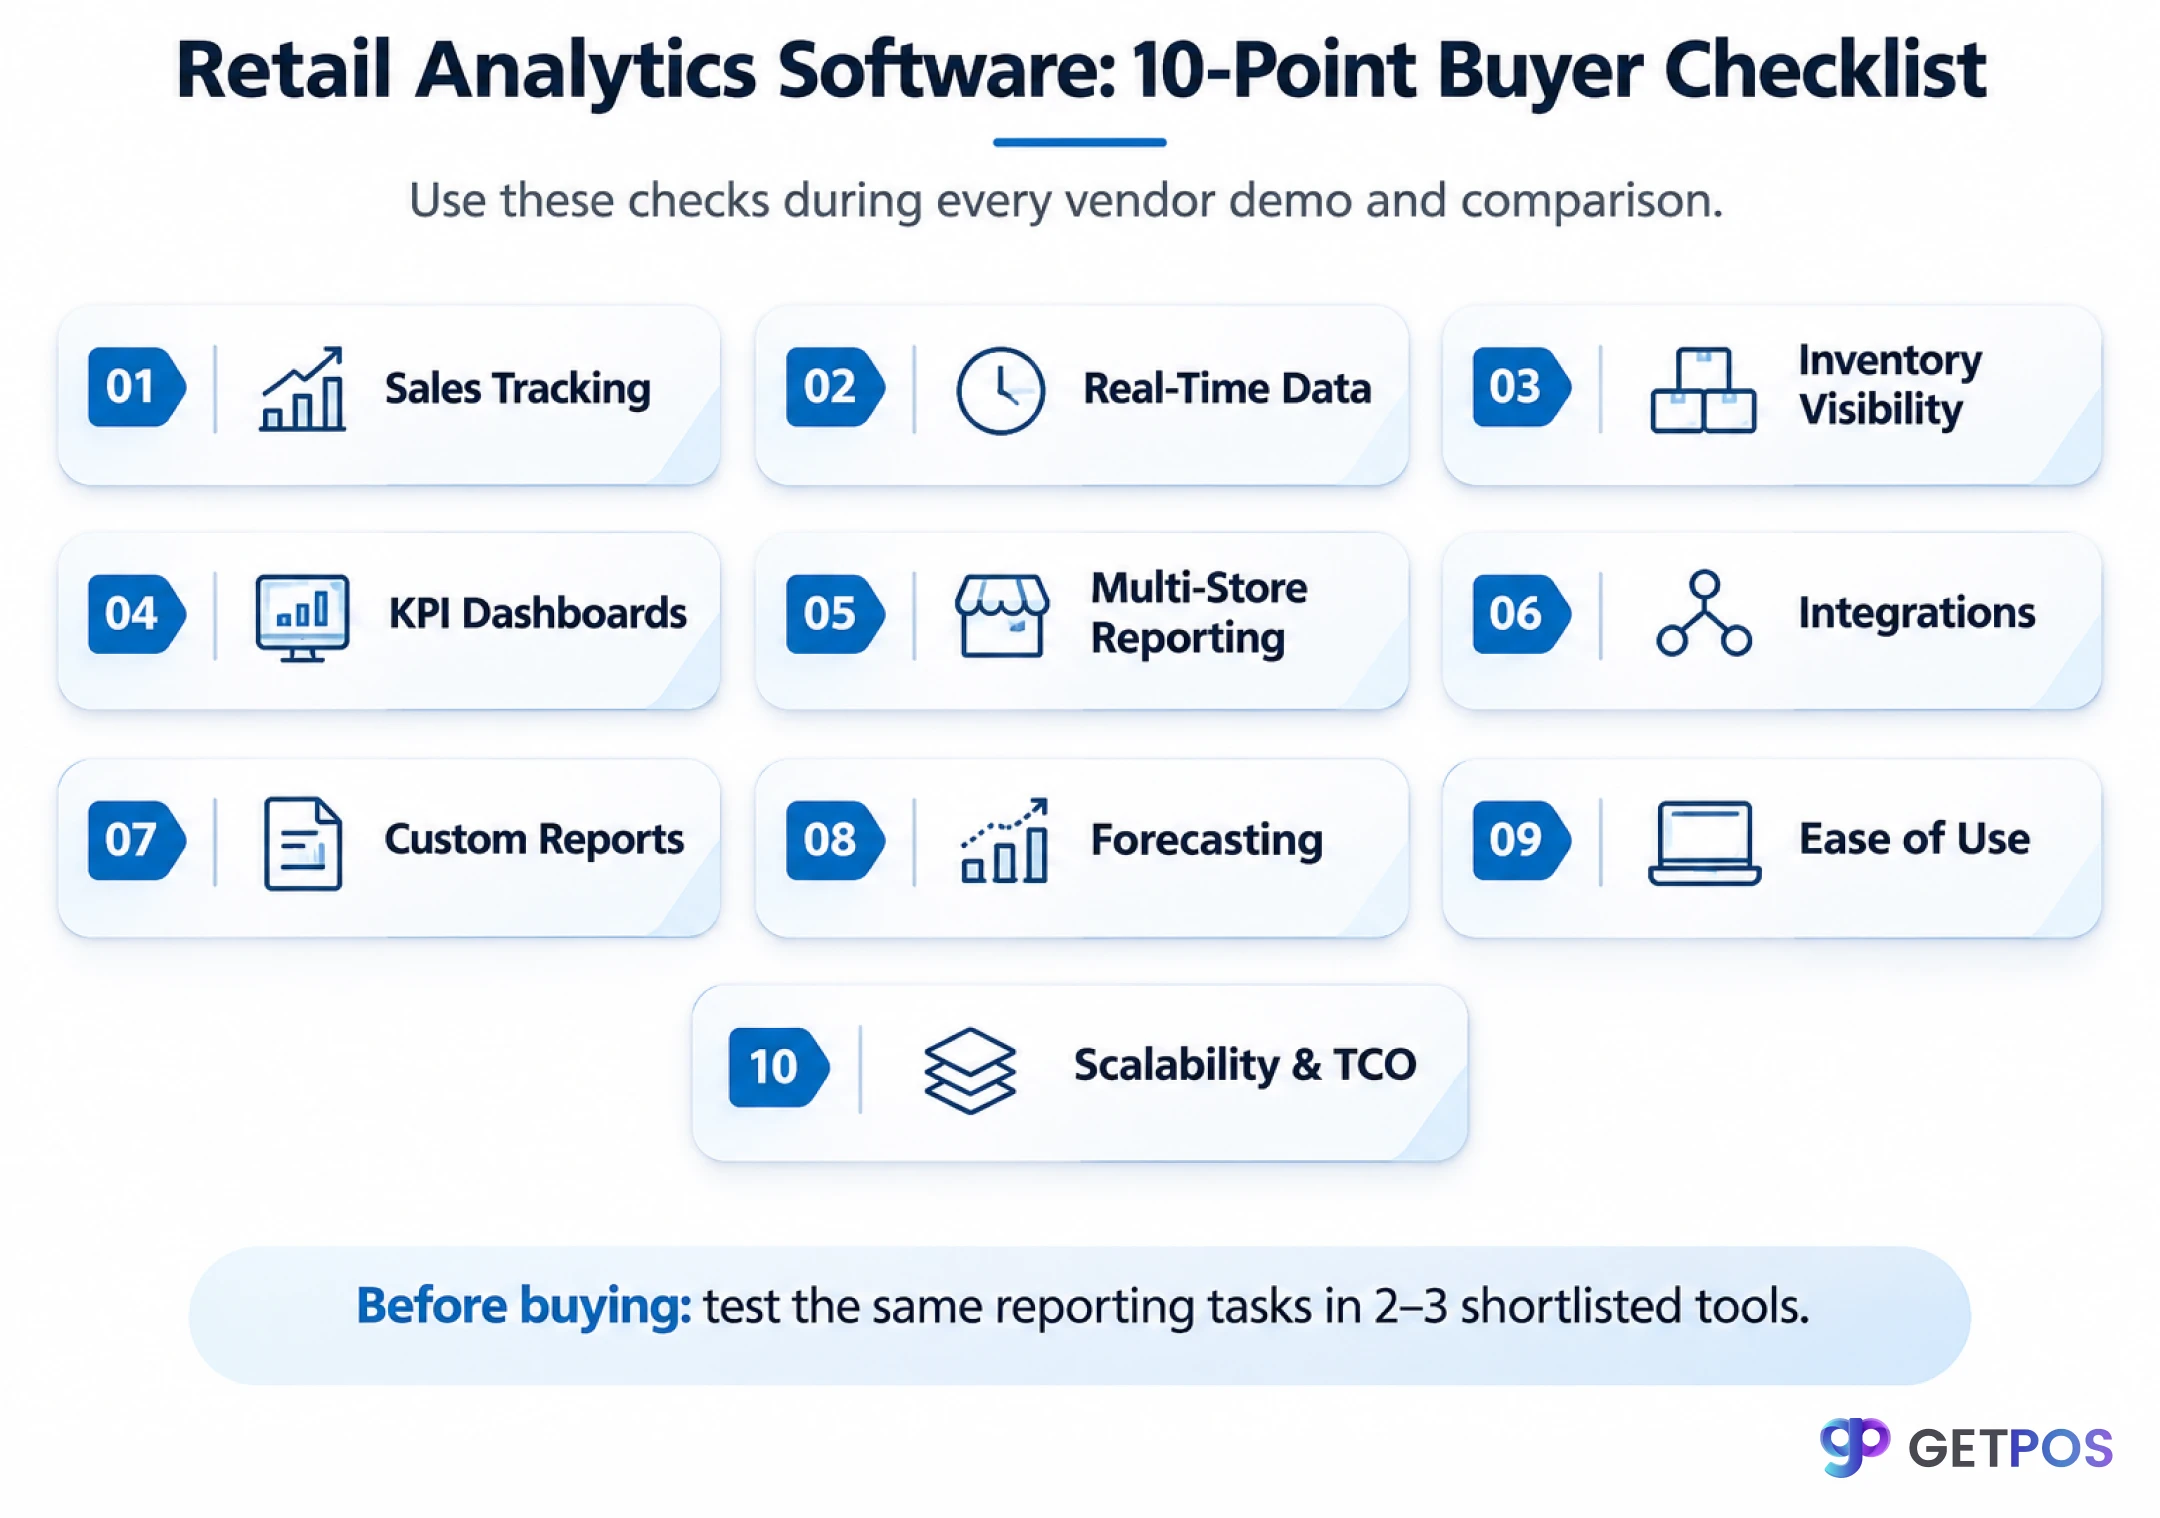
Do not compare vendors only from their feature pages. Shortlist two or three solutions and give each vendor the same reporting tasks. This makes it easier to compare actual usability, data quality, integrations, and cost.
Next step: explore retail analytics software capabilities
Evaluation area | What to verify |
|---|---|
Business requirements | List the five decisions the software must help your team make every week. |
Accuracy and security | Test sample figures and ask about permissions, access controls, auditability, and data protection. |
Integration fit | Map sales, inventory, accounting, ecommerce, and other systems before signing. |
Scalability | Price future outlets, users, data volume, permissions, and new channels—not only today's setup. |
Implementation and support | Ask who handles onboarding, training, troubleshooting, upgrades, and integration issues. |
Total cost | Compare subscription, implementation, integrations, training, support, and upgrade costs together. |
Red Flags to Watch For
Reports depend heavily on manual spreadsheet exports.
Data refresh timing is unclear or inconsistent.
Important integrations require unexpected extra fees.
Custom reports need vendor involvement for simple changes.
Permissions and data security are not clearly explained.
Watch GETPOS Retail Software in Action
Conclusion: Choose Retail Analytics Software That Fits Your Business
The right retail analytics software should fit the way your business actually operates. Compare reporting needs, data accuracy, integrations, multi-store visibility, usability, security, scalability, support, and total cost—not just the number of features on a product page. A good buying process tests the same real-world tasks across two or three shortlisted tools before making a decision.
Frequently Asked Questions About Retail Analytics Software
Retail reporting software mainly helps produce and distribute reports about what happened. Retail analytics software usually goes further by combining data, enabling comparisons, identifying patterns, and supporting deeper analysis. In practice, many modern platforms include both reporting and analytics capabilities.
There is no single market price. Cost depends on users, stores, data volume, integrations, implementation, and advanced capabilities. Compare the total cost of ownership rather than only the monthly subscription, and ask vendors to price your expected future usage.
Yes. Multi-store comparison is a common requirement for growing retailers. Look for consolidated dashboards, store-level filters, consistent KPI definitions, and the ability to drill from an overall result into a specific location.
Use known transactions or reports from your current system and compare the results. Test totals, filters, date ranges, store-level figures, and refresh timing. Also ask how the platform handles synchronization delays, corrections, missing data, and access permissions.
Ask the vendor to use your real reporting scenarios. Test sales and inventory analysis, store comparisons, custom reports, exports, integrations, permissions, refresh timing, forecasting, support, and a realistic total-cost scenario. The goal is to see how the software works, not just hear about features.