
Quick Summary
Retail analytics is the process of examining sales, inventory, customer and operational data to understand performance and guide business decisions. It helps retailers identify popular products, spot slow-moving stock, understand shopping behavior and compare stores. By turning everyday retail data into useful insights, businesses can plan inventory, respond to demand and measure the results of their decisions.
Table Of Contents
Introduction
Every transaction, stock transfer and customer purchase creates information. Across several stores, that information can quickly become difficult to interpret. Retail analytics connects these records, reveals meaningful patterns and helps teams decide what to stock, promote or improve. Instead of relying only on yesterday’s totals, retailers can use retail data analytics to understand performance and act on emerging opportunities or problems.
Key Takeaways
Retail analytics converts operational records into actionable insights.
Sales, inventory, customer and store data answer different business questions.
Demand forecasting can support purchasing and replenishment decisions.
Connected dashboards make cross-store performance easier to compare.
Insights matter most when teams act and measure the outcome.
What Is Retail Analytics?
Retail analytics is the systematic collection and analysis of retail data to identify trends, explain performance and inform decisions. It combines information from transactions, stock movements, purchasing, customer activity and store operations. Retail business analytics can reveal both what changed and which business factors may deserve closer investigation.
How Retail Analytics Works
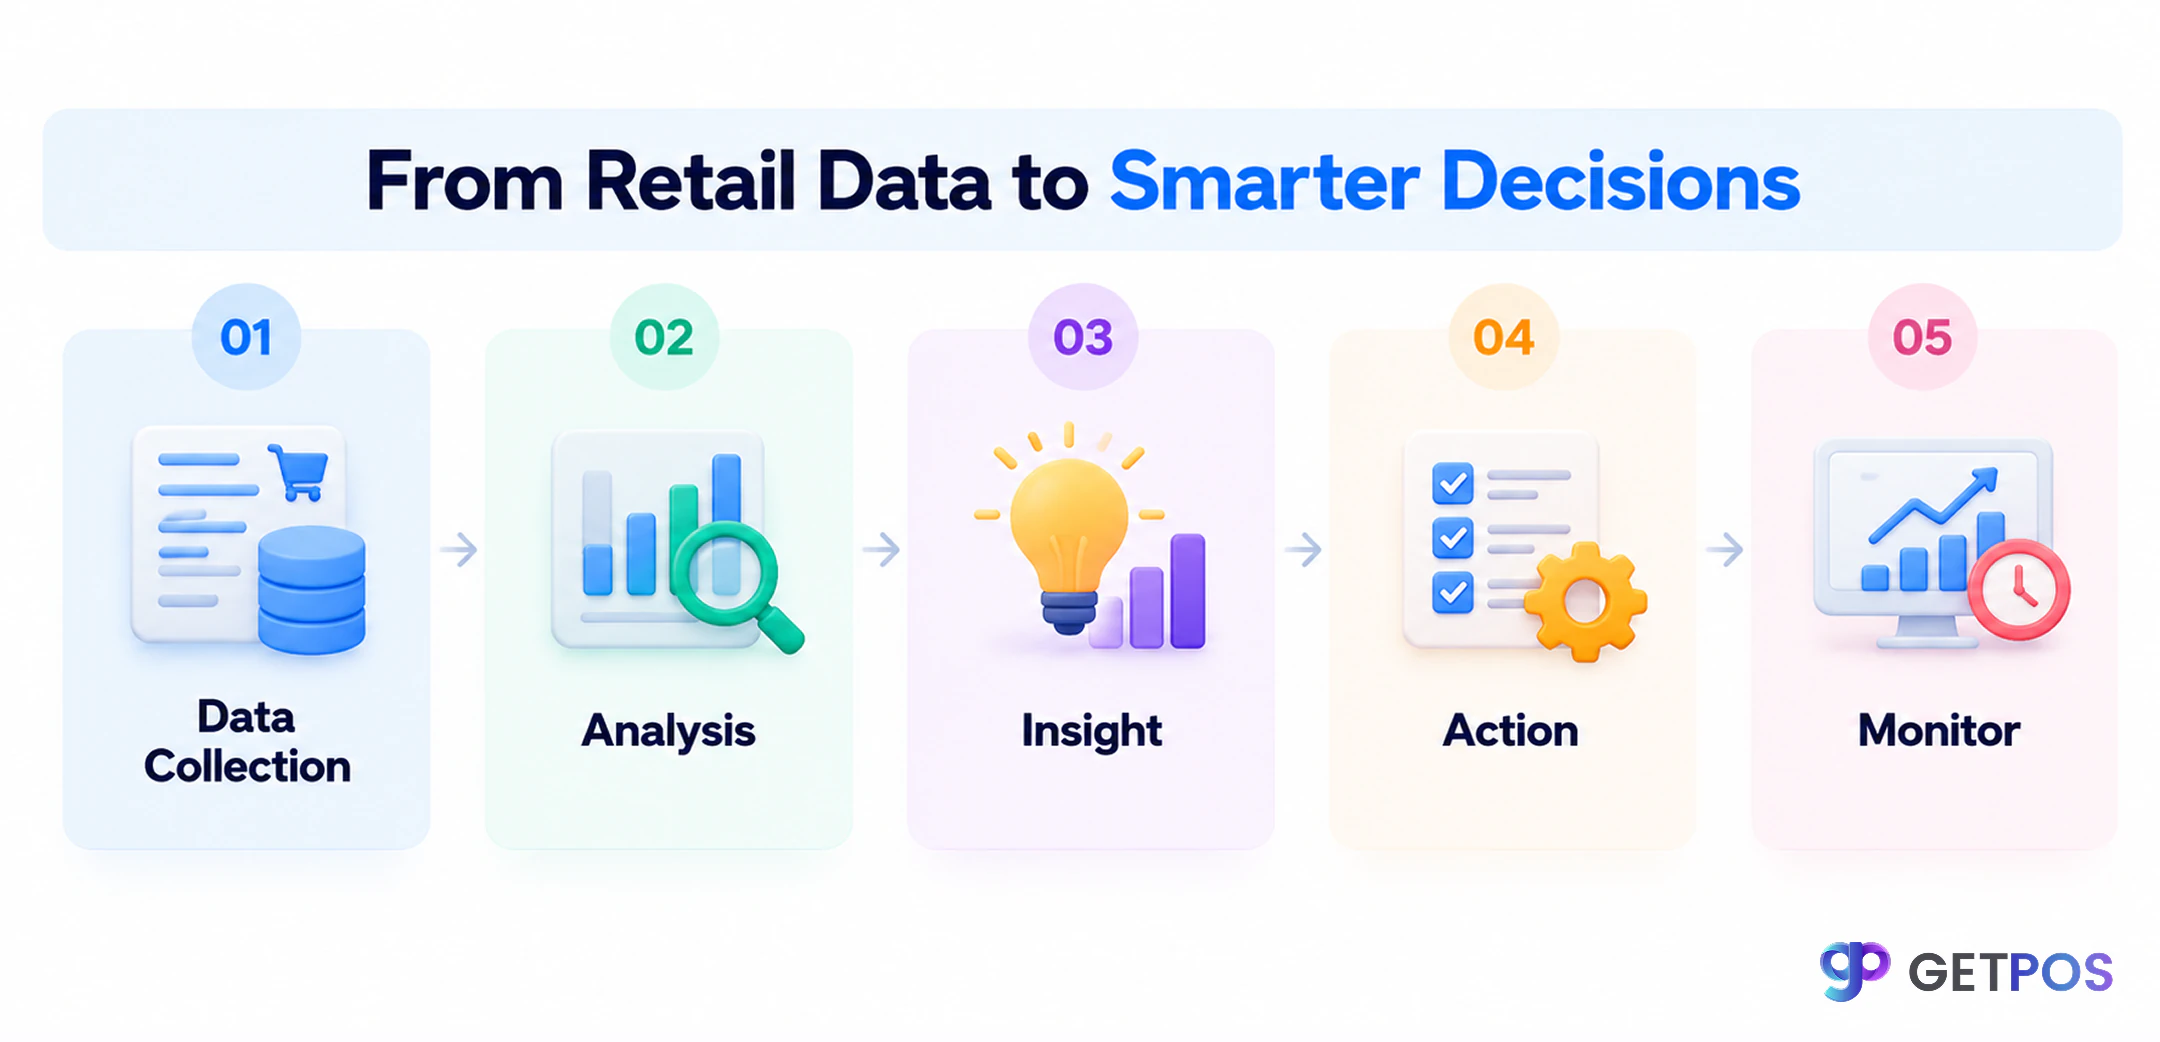
The process follows a practical cycle: collect reliable data, organize it consistently, compare patterns, identify an insight, take action and measure the result. For example, rising sales alongside declining availability may signal a replenishment issue rather than a marketing opportunity.
What Types of Data Can Retailers Analyze?
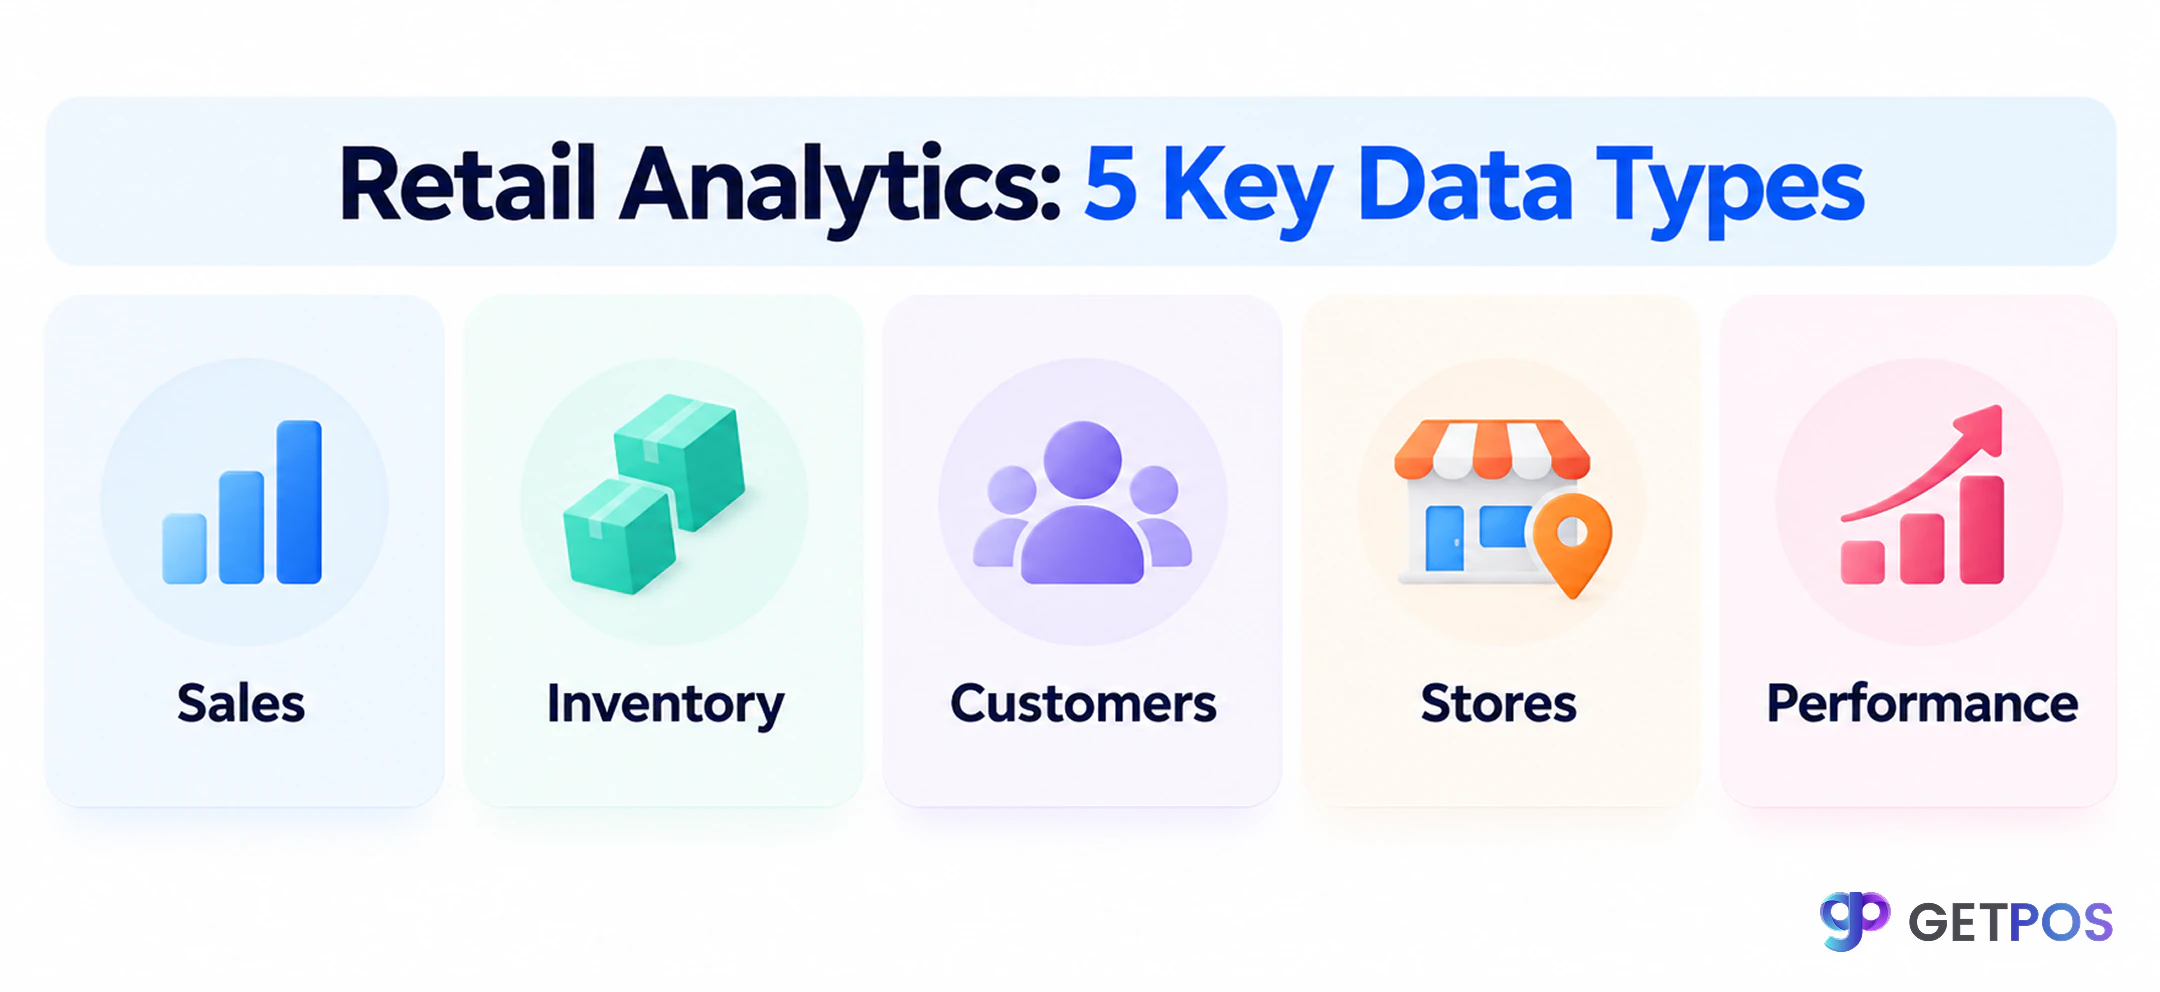
Different datasets answer different questions. Retailers gain a fuller picture when they review these categories together rather than treating each report separately.
Data type | Example metrics | Decision supported |
|---|---|---|
Sales | Revenue, units, average basket | Product and promotion planning |
Inventory | Turnover, ageing, stockouts | Replenishment and transfers |
Customers | Repeat purchases, basket patterns | Offers and assortment |
Stores | Outlet sales, conversion, returns | Staffing and store comparisons |
Performance | Margin, growth, sell-through | Priorities and investment |
How Does Retail Analytics Help Retailers Make Smarter Decisions?
Improve Sales and Product Decisions
Retail sales analytics identifies best-selling products, weak categories and changes by season or promotion. If a category generates high revenue but low margin, a retailer can review discounts or product mix instead of assuming higher sales always mean stronger results.
Optimize Inventory and Demand Planning
Combining sales history with retail inventory management helps teams examine turnover, ageing and stock availability. Retail demand forecasting can guide reorder quantities, while predictive analytics may highlight likely shortages. A retailer noticing slow-moving stock in one outlet could transfer it to a location with stronger demand before ordering more.
Understand Customer Behavior
Retail customer analytics reveals repeat-purchase patterns, popular product combinations and changes in shopping habits. Customer behavior analytics can help teams tailor assortments and relevant offers. Customer data should be collected and used with appropriate privacy controls.
Monitor Store and Business Performance
Retail store analytics helps compare outlets using consistent metrics such as revenue, margins and stock turnover. For chains, multi-store retail management provides a useful operational context for reviewing performance across locations. Compare like-for-like periods and account for store size or local demand before drawing conclusions.
What Is Retail Analytics Software?
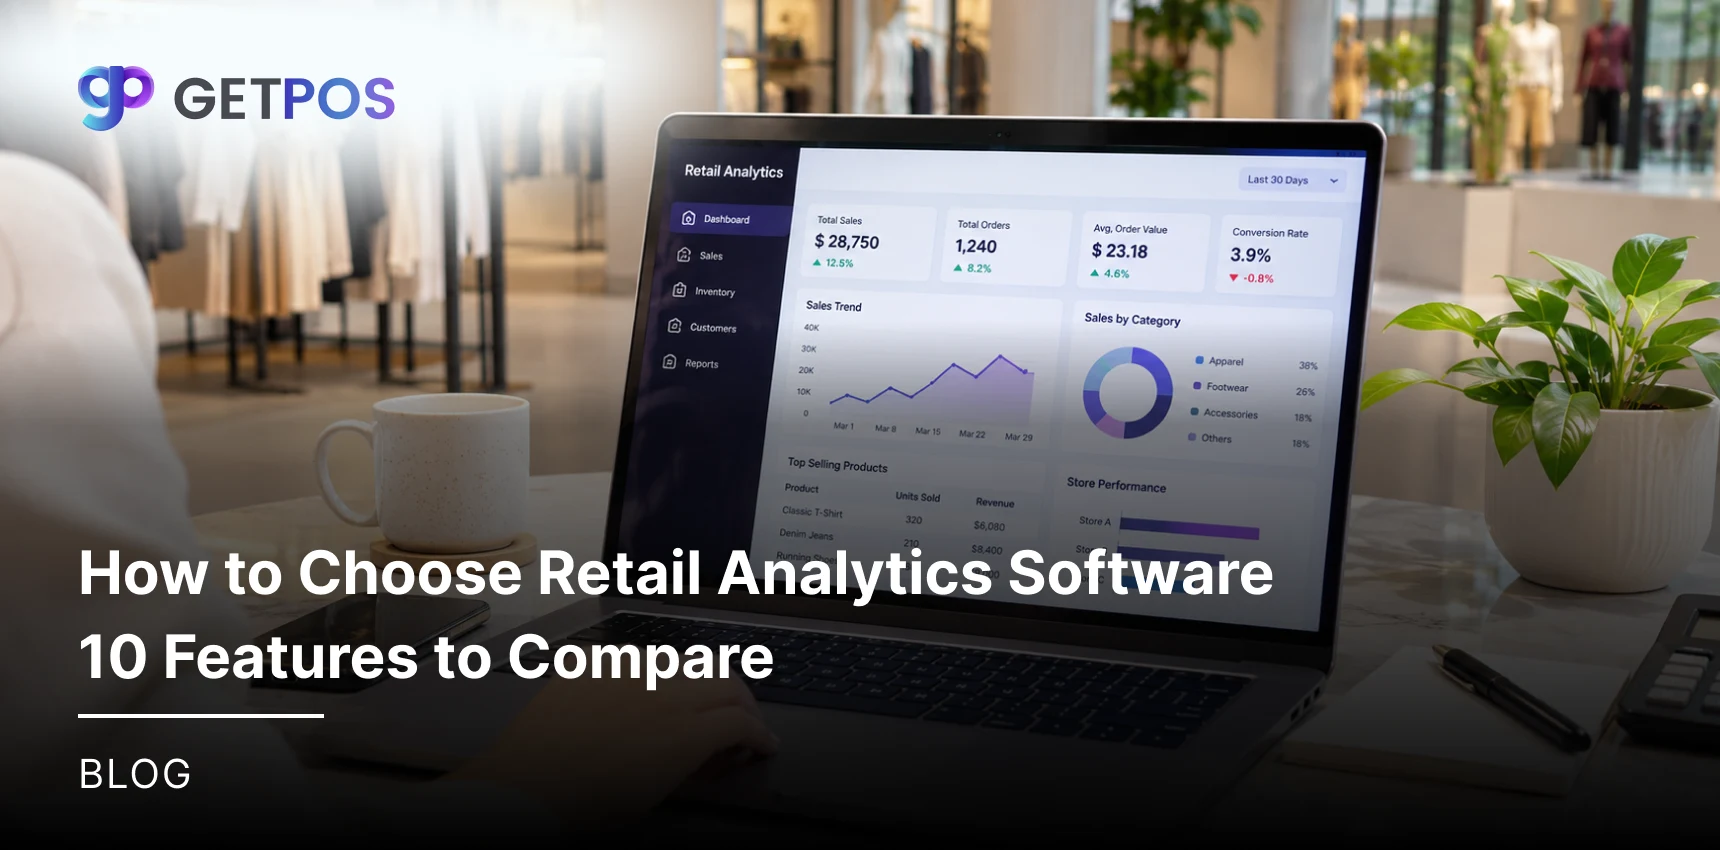
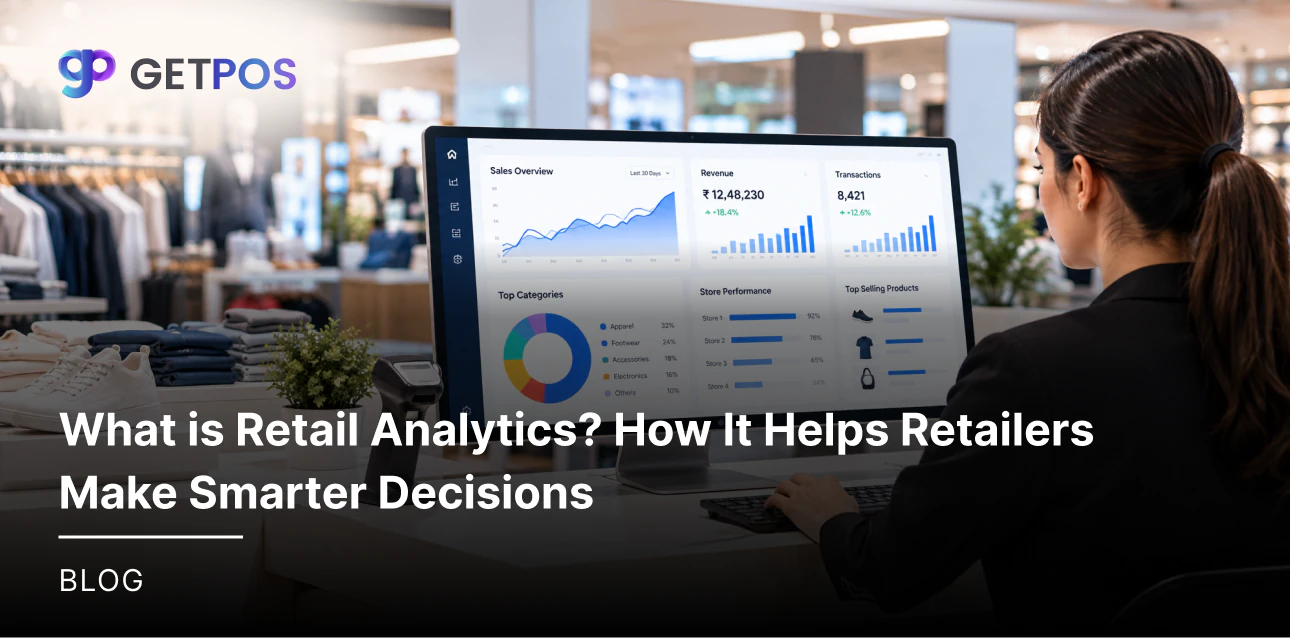
Retail analytics software collects and organizes retail information into dashboards, reports and insights. Typical capabilities include sales trends, inventory metrics, store comparisons, customer insights and, where available, forecasting. The objective is to reduce fragmented reporting and make information easier to act on.
GETPOS offers retail analytics software with live dashboards, sales insights and smart reports. Its broader retail operating system connects sales, inventory, purchasing, accounting and other workflows, giving analytics operational context. Review individual feature requirements before choosing a platform.
Retail Analytics vs. Traditional Retail Reporting
Traditional reporting | Retail analytics |
|---|---|
Summarizes what happened | Explores patterns and possible causes |
Often historical and static | Can combine historical and current views |
Requires manual comparison | Supports interactive analysis |
Produces reports | Connects insights with decisions |
Both are useful: accurate reports provide the foundation, while analytics helps retailers investigate questions and test actions. Neither replaces sound judgment or clean source data.
How to Use Retail Analytics Effectively
Define the question: Choose one question and a measurable KPI, such as stockout rate or gross margin.
Bring the data together: Combine relevant sales, stock, customer and outlet records; check data quality.
Find the patterns: Investigate patterns and compare periods, products and locations fairly.
Act and measure: Take a specific action, then monitor results and adjust the approach.
For broader context on analytics and responsible measurement, see the NIST AI Risk Management Framework.
Conclusion
Retail analytics turns routine sales, inventory, customer and store records into practical insights. The value comes from asking clear questions, acting on evidence and tracking results—not collecting more dashboards. Connected retail analytics solutions can help teams make informed product, replenishment, customer and store decisions as their operations grow.
Frequently Asked Questions
Retail analytics is the analysis of sales, inventory, customer and store data to understand performance and support decisions. Retailers use it to identify trends, compare results and evaluate changes in products, stock or operations.
It helps retailers move beyond isolated reports. By combining operational information, teams can spot stock problems, assess promotions, understand customer demand and track whether their decisions improve performance.
Common types include retail sales analytics, inventory analytics, customer analytics, store analytics and business performance analytics. Each focuses on different metrics, but the most useful decisions often combine several types.
Inventory analytics tracks stock levels, turnover, ageing and movement. When combined with sales trends and supplier lead times, these insights can support replenishment, transfers and identification of excess or slow-moving stock.
Retail analytics software brings retail data into dashboards, reports and analytical views. Depending on the platform, it may support near-real-time performance monitoring, store comparisons, customer insights and demand forecasting.
Predictive analytics uses historical patterns and relevant variables to estimate future demand. Forecasts can inform purchasing and staffing plans, but retailers should review seasonality, promotions, data quality and unexpected changes before acting.